

Price Performance Indicators
Product | Price | % change |
GOLDUD | 1924.18 | 0.17% |
GOLDGR | 945800 | 0.85% |
XAUUSD | 1925.56 | 0.21% |
COMEX | 1926.2 | 0.23% |
USD/IDR | 15130 | 0.73% |
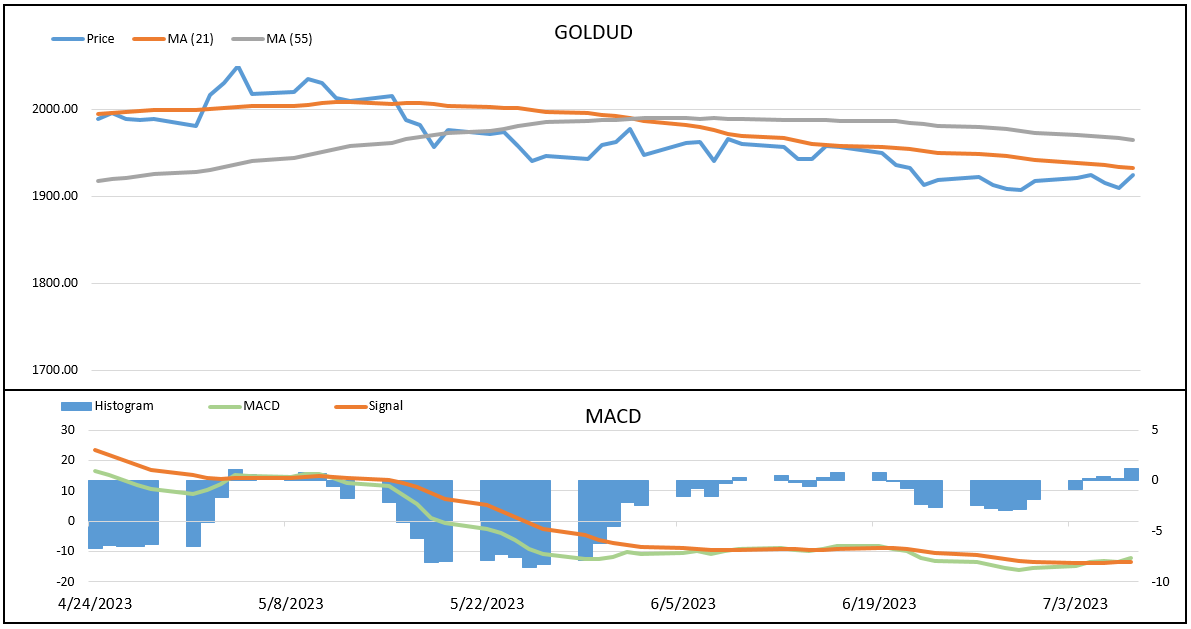
Gold Focus :
- The ICDX gold price strengthened 0.17% in the week (03/07 - 07/07).
- US employment data and US-China trade competition.
Market Review
ICDX gold price ticks higher by 0.17% compared to the previous week, pushed by weaker US economic data and increasing US-China trade war tensions. US inflation data is still in focus.
Gold price movement during the week was influenced by various important US data. The survey results from the Institute for Supply Management show that the US Manufacturing PMI is at level 46, marking manufacturing activity below the 50 threshold and record the lowest level since May 2020. The US Manufacturing PMI was previously projected to rise to level 47 from May data of 46.9. Separate data from the US Department of Labor reported US Nonfarm Payrolls recorded a slowdown to 209K from a previously reported 306K increase and missed expectations of 225K. Weak data suggesting a cooling economy casts doubt over the strength of the labor market on the Fed's rate hike trajectory supporting market participants to safe-haven assets.
The increasing tension of the US - China cold war also strengthened the gold positive movement. Chinese authorities announced controls on exports of some gallium and germanium products widely used in semiconductors, electric vehicles and high technology effective August 1 following restrictions on US shipments of AI chips to Beijing. This policy increases the tension of the trade war between China and the US and has the potential to cause more disruption to global supply chains.
Market View
US Inflation Data In Focus
Gold is sensitive to the tightening of the Fed's monetary policy so that the continuation of the benchmark interest rate increase is still the focus of market players. The focus now turns to the US Consumer Price Index (CPI) and Producer Price Index (PPI) data which will be released this week and have the potential to influence the US central bank's policy stance. The Federal Open Market Committee's next meeting is scheduled for July 25-26. The US CPI on an annual basis is projected to ease to the level of 3.1% from the 4.0% reported in the previous month, while the US PPI is projected to increase at a pace of 0.4% on an annual basis compared to the previous month's increase of 1.1%.
WEEKLY ECONOMIC DATA & EVENTS CALENDAR
Date | Data / Events | Actual | Expectation | Previous | |||||
10-Juli | USD - Fed Barr Speech | - | - | - | |||||
10-Juli | USD - Wholesale Inventories MoM | 0% | -0.1% | -0.3% | |||||
10-Juli | USD - Fed Daly Speech | - | - | - | |||||
10-Juli | USD - Fed Mester Speech | - | - | - | |||||
10-Juli | USD - Fed Bostic Speech | - | - | - | |||||
11-Juli | USD - Consumer Credit Change | $7.24B | $20.25B | $20.32B | |||||
11-Juli | USD - Fed Bullard Speech | - | - | - | |||||
12-Juli | USD - Core Consumer Price Index YoY | - | 5% | 5.3% | |||||
12-Juli | USD - Consumer Price Index YoY | - | 3.1% | 4.0% | |||||
12-Juli | USD - Core Consumer Price Index MoM | - | 0.3% | 0.4% | |||||
12-Juli | USD - Consumer Price Index MoM | - | 0.3% | 0.1% | |||||
12-Juli | USD - Fed Kashkari Speech | - | - | - | |||||
Source: ICDX Research
- EURUSD Bergerak Datar, Pasar Cermati Konflik Timur Tengah dan Prospek Kebijakan The Fed
- Minyak Menguat Dipicu Meluasnya Konflik AS - Iran ke Wilayah Regional Sekitar
- GBPUSD Melemah di Tengah Meningkatnya Permintaan Dolar AS sebagai Safe Haven
- Laju Bullish Minyak Bertahan Seiring Terus Berlanjutnya Serangan AS - Iran
- AS Kembali Blokade Pelabuhan Iran, Harga Minyak Ikut Melaju Bullish